

Distribution of Daily Stock Returns Calculator
The calculator computes the individual return for each buy and sell combination for a specified period in days and places the return in a preset return category for any stock, exchange-traded fund (ETF) and mutual fund listed on a major U.S. stock exchange and supported by Alpha Vantage. Some stocks traded on non-U.S. exchanges are also supported. Indexes are not supported.
The results are displayed in a chart of frequency of buy/sell returns for each return category.
What is a Buy/Sell Combination?
Think of a buy/sell combination as a trade that buys a stock on a given date for a given price and sells the stock on a future date at a given prices. Each buy/see combination results in a return that is unprofitable (value of return is <= 0) or profitable (value of return > 0). This would represent a realized gain or loss. Another definition of a buy/sell combination is to the buy the stock on a given date and hold it on a future date. This would represent and unrealized gain or loss.
The calculator computes the percent return ((Sell Price -Buy Price) / Buy Price) * 100 for each buy and sell combination for the specified stock and time period, places the return in a preset return category that has a lower and upper return limit, computes the total number of returns in each category and finally computes the percentage of total number of returns for each return category.
Finally, the calculator computes the percentage of all returns that are profitable and unprofitable.
The calculator uses daily closing prices that are adjusted for splits and dividends.
Note: If the stock does not have price data for the specified Return Period, the calculator uses the earliest date of available prices.
Sample Returns Distribution Chart for Apple (AAPL)
This chart shows the frequency distributions of 3,168,903 daily buy/sell returns for Apple (AAPL) that were generated from ten years of 2,518 closing daily prices ending January 30, 2024. The Y axis gives the frequencies in percent of all returns. The label on the X axis is the upper percent limit of a return category.
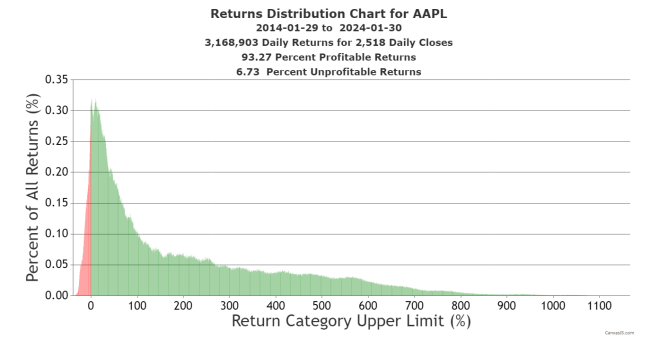
The number of buy/sell returns is equal to:
Number prices * (Number prices - 1)/2 = 2518 * (2518 - 1) / 2 =3,168,903.
Each column on the chart represents the frequency of the returns for a single return category. The frequency of return for a category is equal to:
(Number of buy/sell returns in the category / total number of all buy/sell returns) * 100.
Each return category has an lower and upper limit that are 0.5% in width.
Profitable return categories have green columns. Unprofitable return categories have red columns. For this chart 93.27% of all returns were profitable and 6.73% were unprofitable.
The height of each column represents the frequency of the returns in a category not the actual values of the buy/sell percent returns that fall into the category.
The pattern of a return distribution varies between stocks and durations. They are determined by the underlying pattern of the closing daily prices for the stock and the specified period.
See Does the Gumbel Distribution Mirror Daily Stock Returns?
Related Return Calculators
Daily Stock Return Calculator and Chart Maker - See Trends and Streaks for Last 100 Days
Stock Holding Period/Return Calculator
Stock Return/Purchase Date Calculator - Buying on Price Dips is Profitable
Stock Return Map Maker See all returns for buy and sell combinations.