
Does the Gumbel Distribution Mirror Daily Stock Returns?
I (RAH) am currently working to find a curve that fits well with daily stock returns. One promising model is the Gumbel distribution.
The chart below shows a series of buy/sell returns for Apple (AAPL) for a four year period. The Y axis represents the percent of all returns that fall in a given percent return category as shown on the X axis. See Distribution of Daily Stock Returns Calculator for a detailed description of the red and green columns.
The black continuous curve are values computed using the Gumbel probability density function. Each point on the curve represents the percent of all returns that fall in a given percent return category.
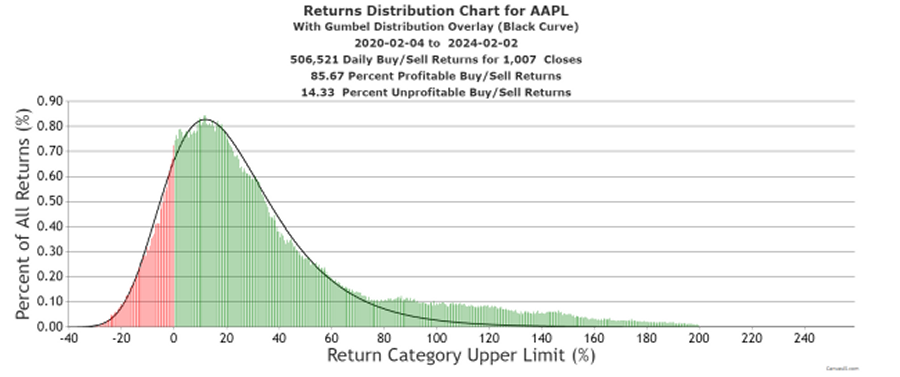
The Gumbel generated curve fits well from the -40 percent return category up until the 80 percent return category after which the Gumbel values clearly underestimate the actual percent of all return data. I did not do any formal goodness-of-fit testing.
I will post more charts for different periods and stocks in the coming weeks.
Posted February 5, 2024.