Bollinger Bands Define Upper and Lower Price Boundaries
Bollinger Bands, developed by the professional technical analyst John Bollinger, define a price envelope in which prices fluctuate. The upper band lies two standard deviations above a simple moving average of prices and the lower band falls two standard deviation below the moving average. The width of the bands expands and contracts with the volatility of prices. So wide swings in prices result in wide distances between the upper and lower bands and relatively stable prices result in a narrow ranges.
Often Bollinger Bands narrow before prices change from the downside to the upside or from the upside to the downside. Therefore, traders and investors use Bollinger Bands to help determine changes in price direction.
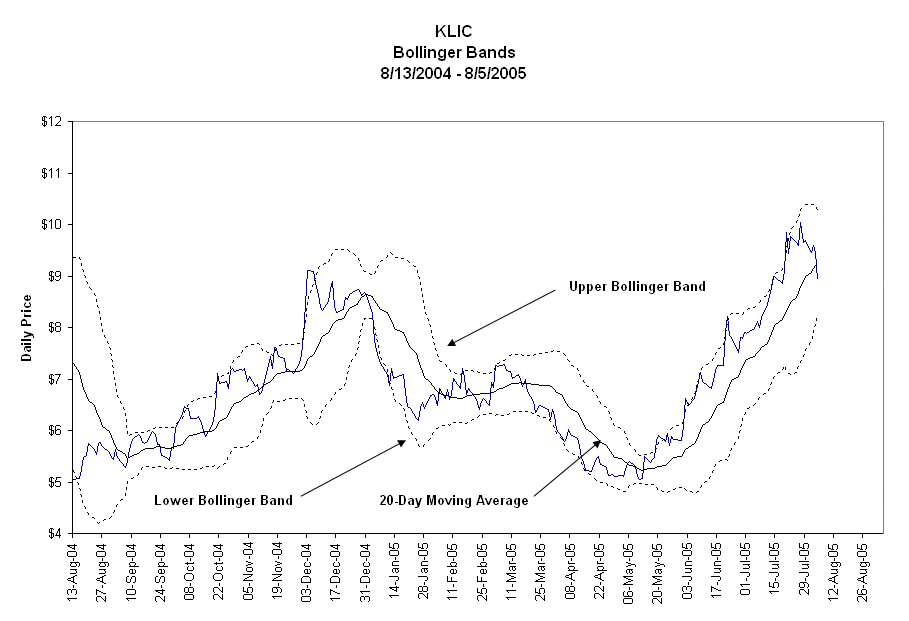
The chart of the August 2004 to August 2005 price cycles for Kulicke & Soffa (KLIC), a semiconductor equipment maker, shows daily closes (blue line), 20-day moving average (black line) and the upper and lower Bollinger Bands (dashed lines). The chart is somewhat busy so click on it to enlarge it.
Notice that closing prices hug the upper band on the upside and the lower band on the downside. Also, the distance between the upper and lower band is not always the same. The distance tends to widen when prices are volatile and narrow when prices are more stable.

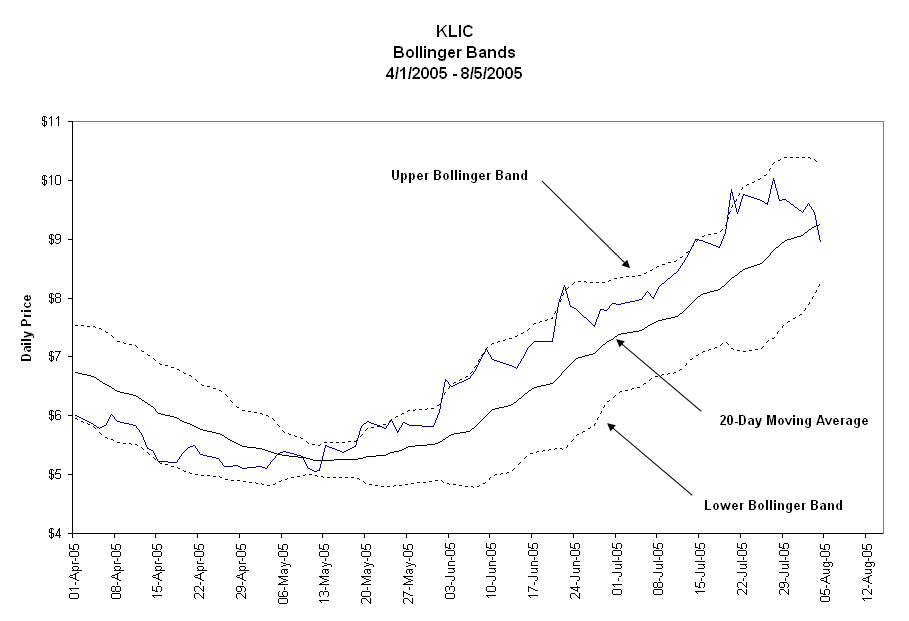
The KLIC chart for the upside from April 2005 through August 2005 upside shows the narrowing of the bands in mid May as prices move from the downside to the upside. On the price upside daily closing prices are above the 20-day moving average and hug the upper band as prices rise. As the price peaks in late July, the daily close moves away from the upper band and drops below the 20-day moving average.

Computing the Bands
To compute the numerical values for the two bands do the following:
- Select the price interval (day, week, month, year or any other interval).
- Select the length of the moving average. Typical lengths are 20, 50, 100 and 200 days.
- Compute the moving average for each price of the price series.
- Compute the standard deviation of the moving average for each price.
- Add twice the standard deviation to the moving average to obtain the value of the upper band.
- Subtract twice the standard deviation from the moving average to compute the lower band.
Related Article and Chart Maker
20-Day, 50-Day and 200-Day Moving Averages Smooth a Price Series
