
Topping Price Pattern - Triple Top
A triple top includes three upside formations with approximately the same peak price levels. The downside that follows the third top declines below the lowest bottom of the two preceding tops.
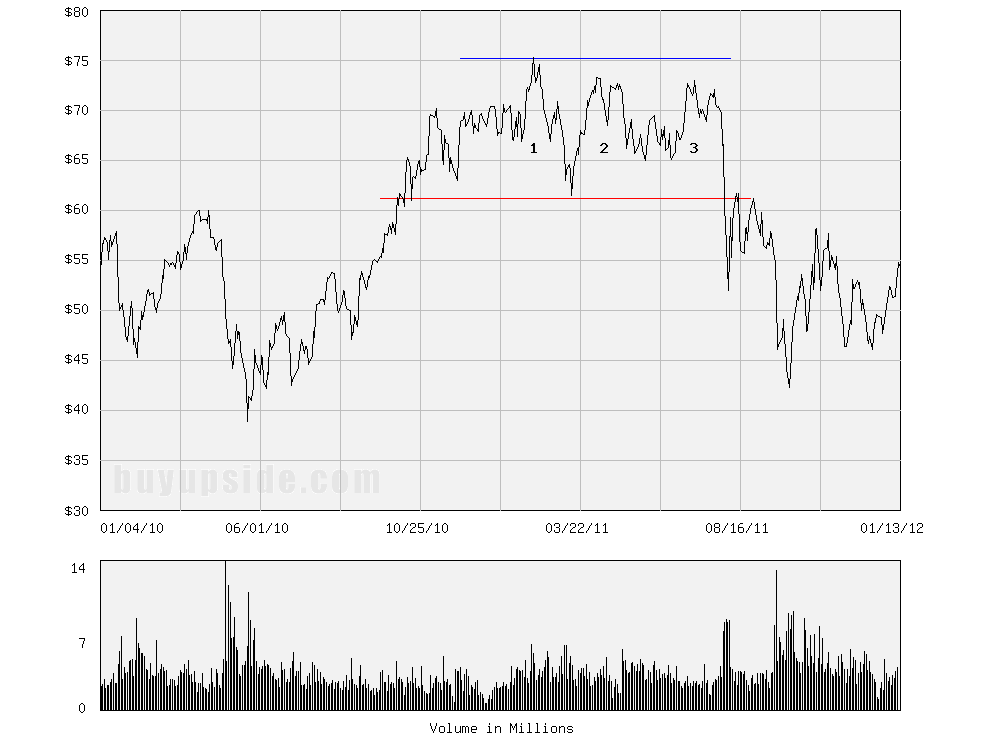
Below is a triple top chart of daily closes from Quandl for Rio Tinto (RIO). The blue horizontal line is the resistance level for the three tops.
The red horizontal line highlights the bottom of the first top formation.
Related Articles
Introduction to Stock Price Patterns
Bottoming Price Pattern - Double Bottom
Bottoming Price Pattern - Reverse Head and Shoulders
Topping Price Pattern - Bubble Top
Topping Price Pattern - Double Top
Topping Price Pattern - Head and Shoulders Top