
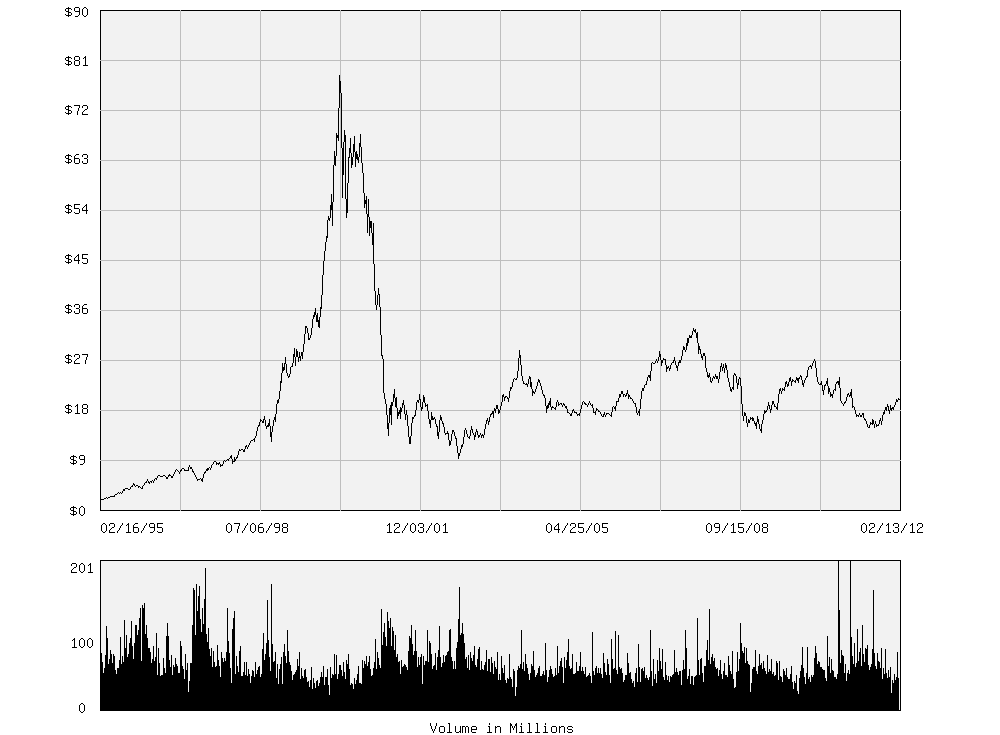
Topping Price Pattern - Bubble Top
Investors frequently bid up the price of a stock to unsustainable levels. Prices make new highs day and day, week after week and month after month. It seems prices will go up forever. People justify paying very high prices by saying "It's different this time."; so they pay more and more for the stock causing a price bubble to form. Eventually the buying binge ends and the price bubble bursts sending prices plunging to the downside.
Below is a bubble top chart of weekly closes from Quandl for Cisco (CSCO). After the bubble burst, the stock price remained well below the bubble high for years.
Related Articles
Introduction to Stock Price Patterns
Bottoming Price Pattern - Double Bottom
Bottoming Price Pattern - Reverse Head and Shoulders
Price Bubbles Always End Badly
Topping Price Pattern - Double Top
Topping Price Pattern - Head and Shoulders Top
Topping Price Pattern - Triple Top