
SPAC Price Bubbles Always End Badly
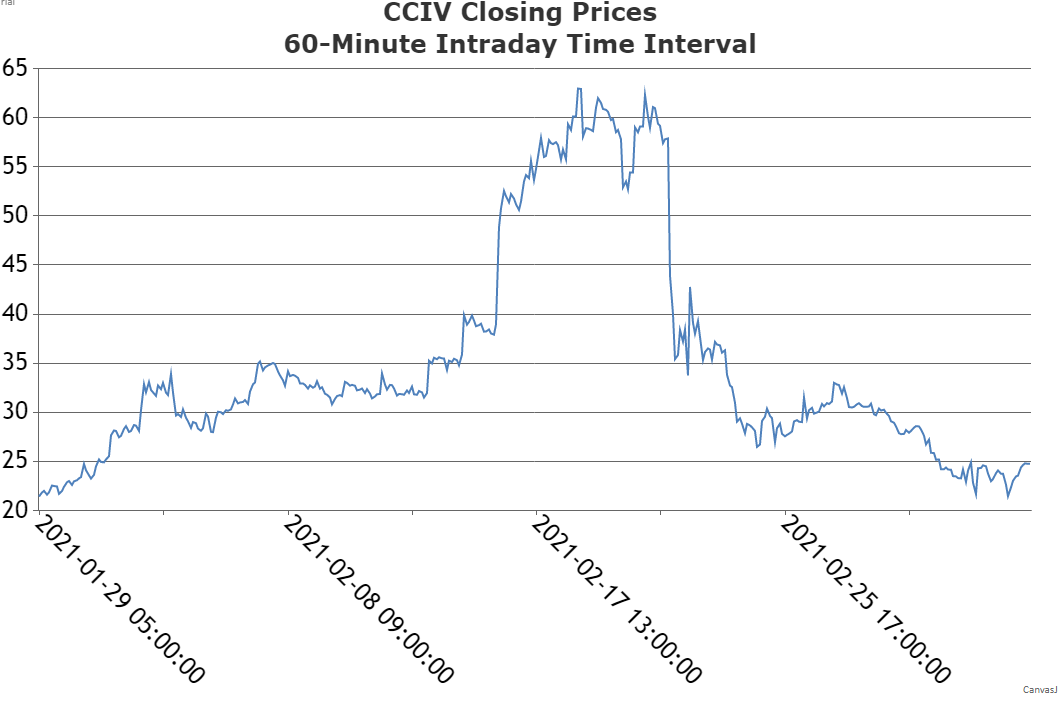
Special purpose acquisition companies (SPACs) have been the rage among investors and speculators as they bid up SPAC prices to ever higher prices in anticipation of successive mergers. However, in many instances the SPAC price falls significantly after the transection is announced. This is what happened to Churchill Capital Corp IV (CCIV). Right after the merger announcement CCIV headed to the downside so that most investors who bought around the peak subsequently lost money.
The following chart of 400 60-minute intraday prices for CCIV from January 29, 2021 through March 5, 2021 shows the upside price bubble and subsequent downside collapse of the 60-minute prices.
During this period the number of profitable and unprofitable returns was about the same.
The pattern of buying and selling defines the structure of any price bubble. In real time, while the bubble is forming, it is difficult to conclusively identify the transition from the price upside to the price downside. But is imperative to know that the buying and selling process that generates a price bubble ensures that prices eventually peak followed by an unrelenting downside. Consequently, early buyers make the huge profits while late buyers rack up the losses.
Use the Day Trading and Short Squeeze Intraday Stock Return Calculator to examine the returns for other time periods of the CCIV bubble.
Related Articles
Introduction to Stock Price Patterns
Bottoming Price Pattern - Double Bottom
Bottoming Price Pattern - Reverse Head and Shoulders
Price Bubbles Always End Badly
Stock Price Pattern Analyzer - Bubble Top
Topping Price Pattern - Bubble Top
Topping Price Pattern - Double Top
Topping Price Pattern - Head and Shoulders Top
Topping Price Pattern - Triple Top