
Price Bubbles Always End Badly
Many investors have short memories when it comes to soaring stock prices. They think that prices with go ever higher and forget (or did not know) that at some point people will start selling to preserve their gains. And when the selling accelerates, prices will head to the downside leaving the last buyers with losses, some of which can be substantial.
The short-squeeze frenzy around GameStop (GME) in January and February 2021 is a classic example of how a price bubble inflates to an unsustainable upside and then collapses to the downside.
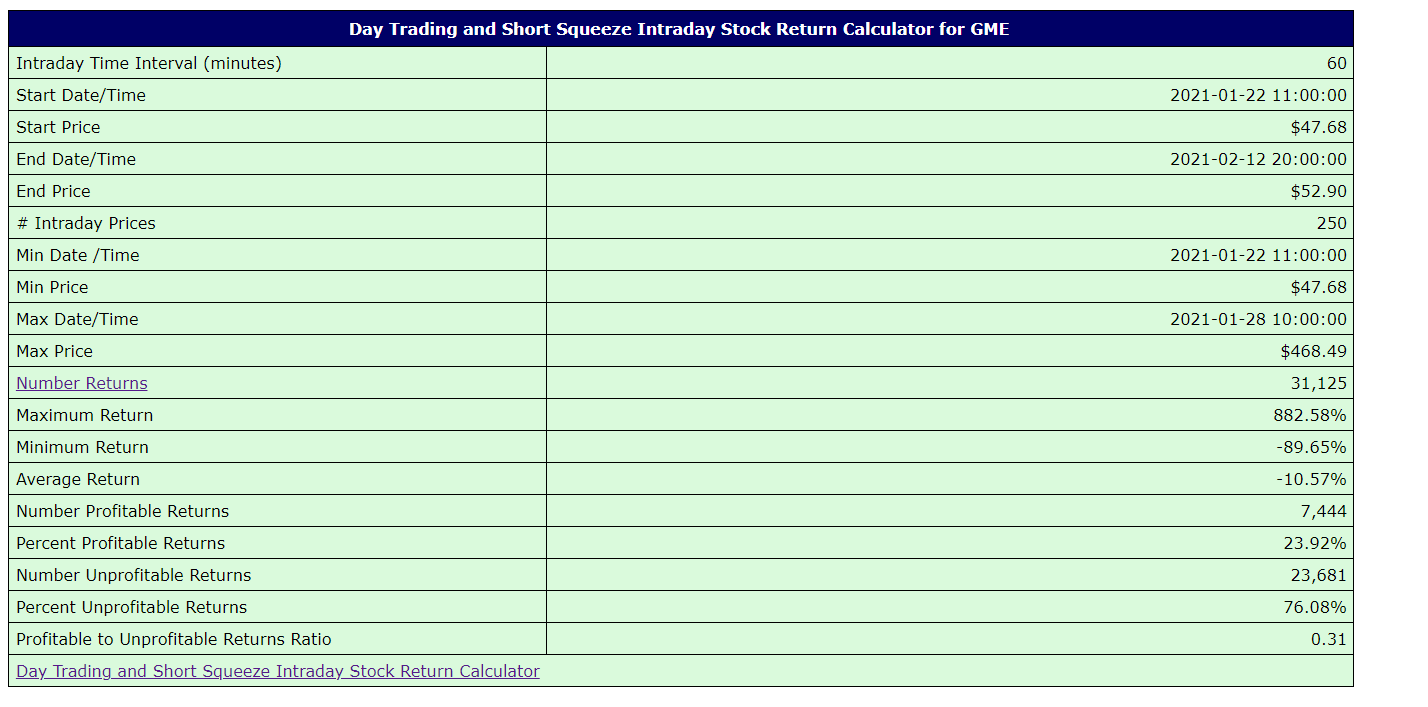
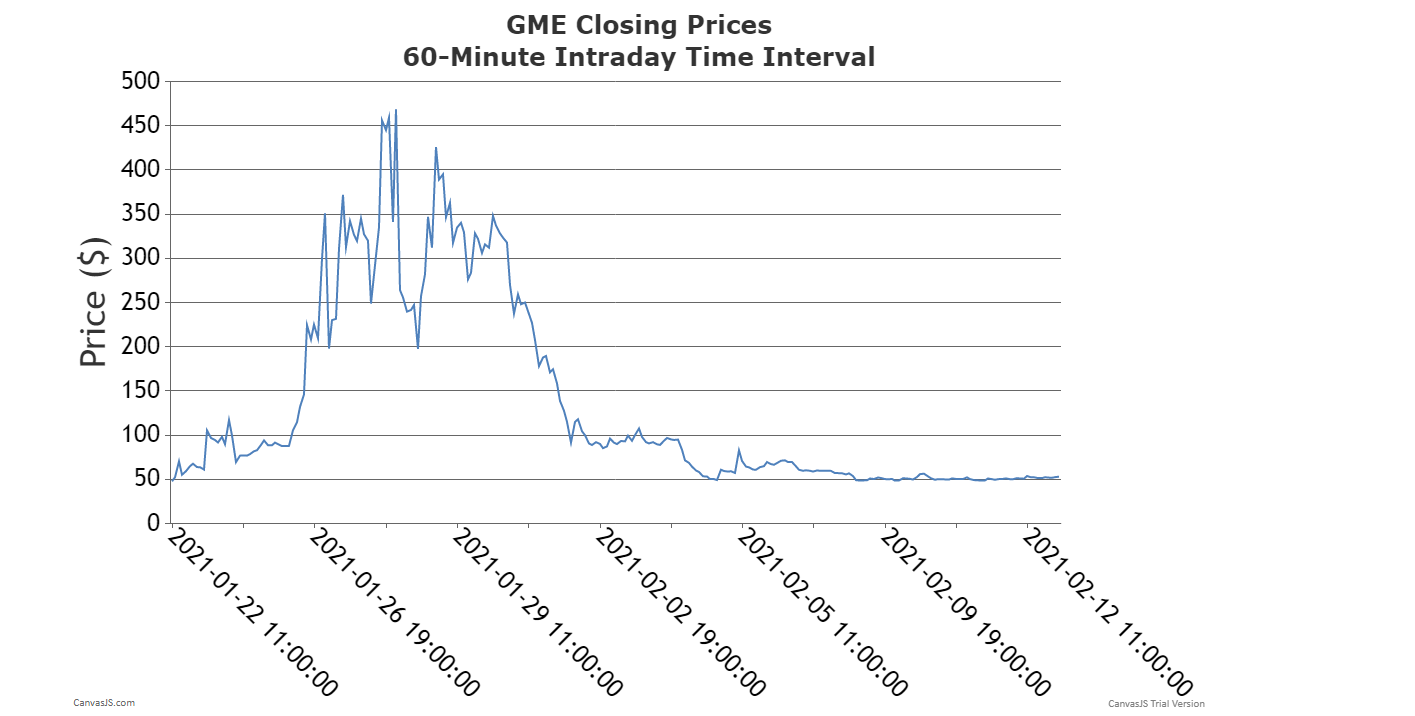
The following table of 250 60-minute intraday prices for GME shows a summary of 31,125 returns (Number Returns) from January 22, 2021 through February 12, 2021. The chart shows the upside and subsequent downside of the 60-minute prices.
During this period only 7,444 (23.92%) trades made money while 23,681 (76.08%) lost money. Notice the large number of prices that were on the price downside after prices peaked on January 28.
The pattern of buying and selling defines the structure of any price bubble. In real time, while the bubble is forming, it is difficult to conclusively identify the transition from the price upside to the price downside. But is imperative to know that the buying and selling process that generates a price bubble ensures that prices eventually peak followed by an unrelenting downside. Consequently, early buyers make the huge profits while late buyers rack up the losses.
Use the Day Trading and Short Squeeze Intraday Stock Return Calculator to examine the returns for other time periods of the GME bubble.
Related Articles
Introduction to Stock Price Patterns
Bottoming Price Pattern - Double Bottom
Bottoming Price Pattern - Reverse Head and Shoulders
SPAC Price Bubbles Always End Badly
Stock Price Pattern Analyzer - Bubble Top
Topping Price Pattern - Bubble Top
Topping Price Pattern - Double Top