Stock 3d Percent Returns Chart: Transocean Ltd. Bounces off Low After Prolonged Downside
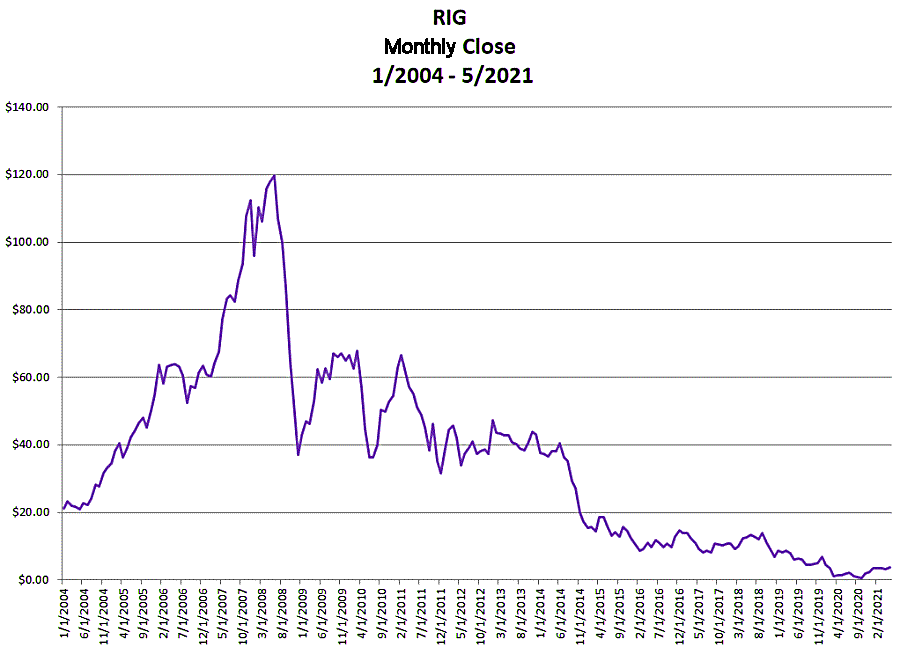
Transocean Ltd. (RIG), an offshore contract oil and gas driller, peaked in June 2008 at $119 and then went to the downside to bottom in October 2020 at $0.6705. It then bounced to $3.78, a 464 percent return, in May 2021.
3D Percent Returns Chart
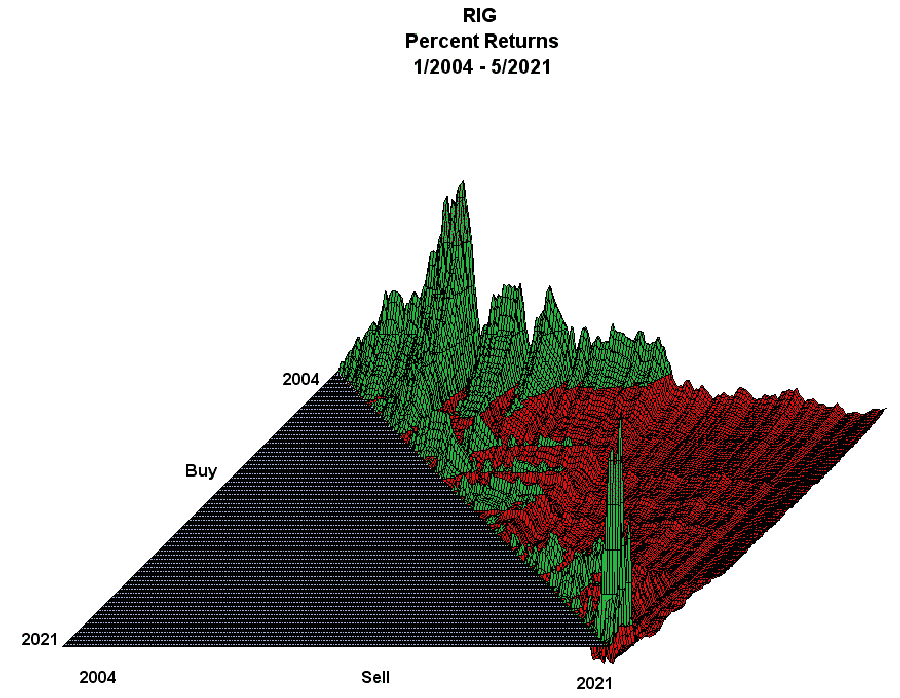
The 3D percent returns chart shows the gains and losses for the monthly buy and sell returns from January 2004 through May 2021.
The green areas represent the profitable returns and the red areas represent the unprofitable returns. Of the 21,528 buy and sell returns 3,966 (18.42%) made money and 17,562 (81.58%) did not.
The green spike in returns located in the lower right of the returns chart represents returns after prices bottomed in October 2020.
Related Articles and Calculator
Stock 3d Percent Returns Chart Articles
Analyzing Price Upsides and Downsides
Cyclical Price Return Calculator


